An infographic created as an exercise during a job interview for a position at UW-Madison back around 2008 or so…
While not anything earth-shattering, I remain proud of this given the circumstances – I was given three pages of graduation stats and 20 minutes to a) determine what was “significant”, b) choose an audience, c)“convey the data”…
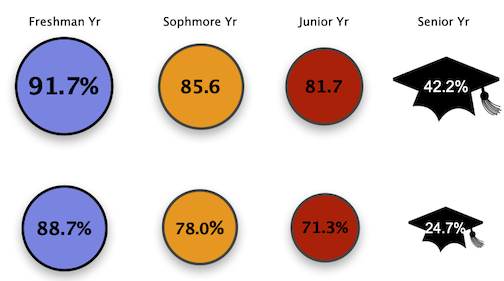
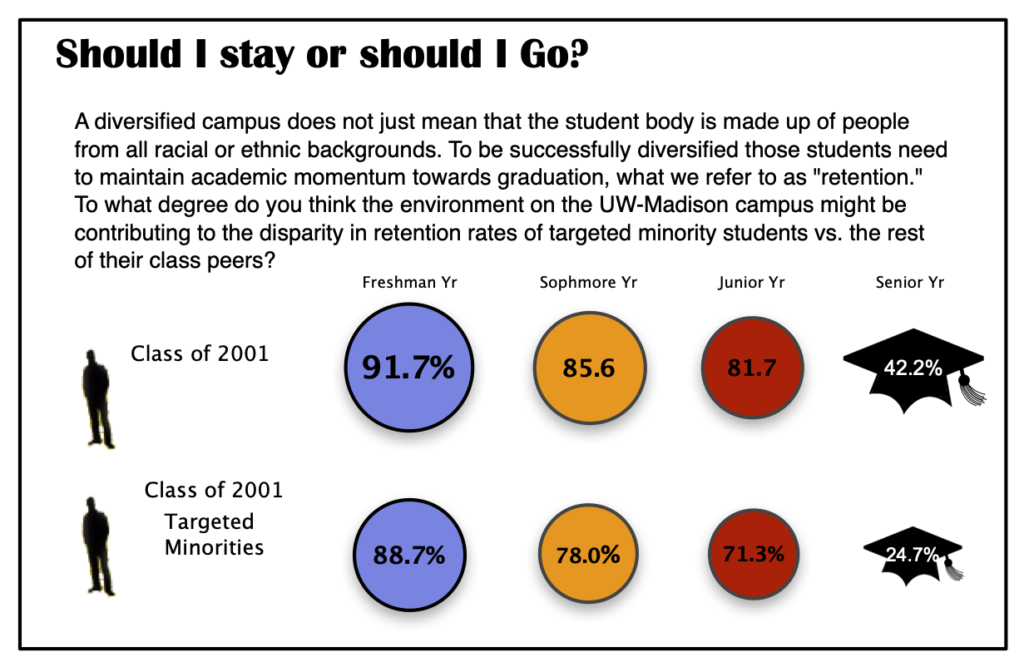
Luckily, I had my laptop with me; I focused on the retention rate disparities and created a graphic in Omnigraffle geared toward a general campus audience (for an imaginary newsletter or annual publication).